Insight
The dashboard, the reports and the forecast.
CRM guide 5 of 6 · 11 min · 3 screenshots · updated 10 Sep 2026
- For
- Admin, Sales managers
- Use
- Setup + everyday
- Needs
- Deals with close dates
Covers the three screens that read your CRM rather than change it — the Dashboard at the top of the CRM sidebar, Reports, and Forecasts.
Almost nothing here needs configuring. What it needs is data of a particular shape, and this guide is mostly about which fields these three screens are quietly depending on.
Section 01What each one answers#
Dashboard
What should I do this morning? Personal, configurable, and the first screen most people see.
Reports
What happened, and why? Curated analytics tabs, plus a builder for the question nobody anticipated.
Forecasts
What is going to happen? Open deals sorted by confidence, against targets you set.
Part 1One-time setup
ForAdminSections3Read2 minNeedsA pipeline with win probabilities
Section 02One-time setupThree fields everything here depends on#
There is very little to configure, and a great deal to get right upstream. If any of these is missing, these three screens do not break — they under-report, quietly, which is worse.
| Field | Set where | What goes wrong without it |
|---|---|---|
| Win probability on each stage | Settings → CRM → Pipelines & Stages | Every open deal falls into the lowest forecast bucket |
| Expected close date on each deal | The deal itself | The deal appears in no forecast period at all |
| An enabled currency on each deal | Settings → CRM → Currency Rates | The deal is dropped from every roll-up, silently |
The currency one is the trap. A deal in a currency you never enabled cannot be converted to your base currency, so Forecasts leaves it out of the total rather than guessing at a rate. Nothing warns you, and the number is simply short. If a forecast looks lower than your pipeline feels, check the currencies before you check anything else.
Section 03One-time setupLaying out the dashboard#
WhereSettings›CRM›CRM Dashboard
OpenCRM Dashboard
Choose which sections appear on the CRM home screen and in what order, per role or per person. The sections available are:
- Today's Follow-ups — due and overdue, pinned to the top
- Action Required — overdue follow-ups, ageing deals, expiring and draft quotes
- My Stats and My Pipeline — your own numbers and your stage bars
- Recent Deals & Quotes and Recent Activity
- Partner Channel — registrations and commissions, if you run a channel
- Team Leaderboard and Org Rollups — for managers and admins
- Announcements — the shared company-wide widget
Do this after a fortnight of real use, when you know which panels people look at rather than which ones sound useful.
The team and org sections hide themselves. Team Leaderboard and Org Rollups need the CRM Reports permission to compute at all; without it they do not render an empty box, they simply are not there. So a rep and their manager see genuinely different home screens from the same configuration, which is the intent.
Section 04One-time setupScheduled reports#
OpenReport Schedules
Report Schedules emails a saved report on a cadence — a weekly sales summary to the leadership list every Monday at 9am. It carries a Coming Soon badge: the page works and the schedule saves, but nothing sends yet. Export from the report itself in the meantime.
Part 2Everyday use
ForEveryone, Sales managersSections4Read8 minNeedsPart 1 done once
Section 05Everyday useThe dashboard#
WhereCRM in the sidebar
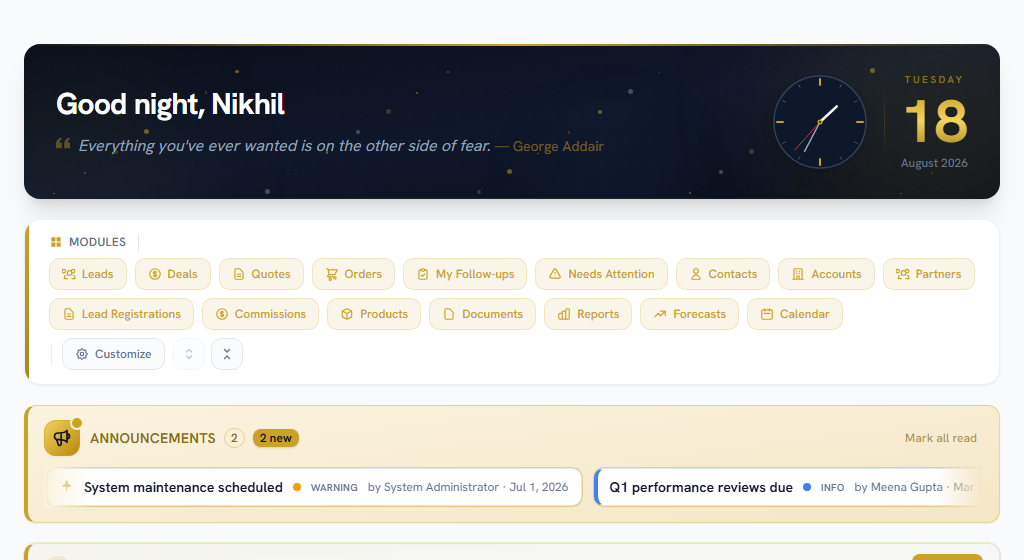
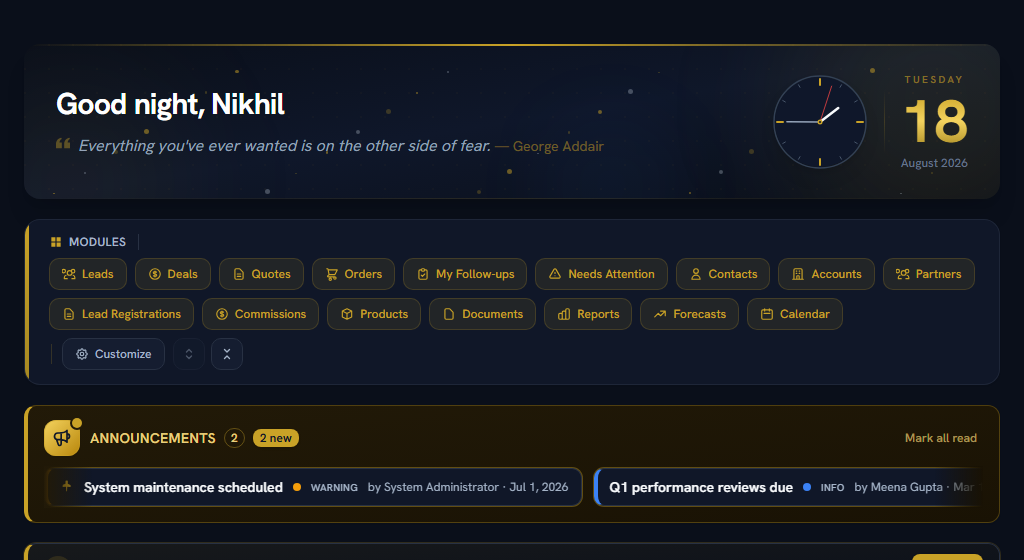
OpenDashboard
Your CRM home. Every section is clickable through to the module underneath it, and the whole page is served from one request, so it loads as one screen rather than as nine spinners.
The two sections worth building a habit around are Today's Follow-ups and Action Required. Between them they are the morning list: what is due, what is overdue, which deals have gone quiet, and which quotes are about to expire while you are not looking.
Section 06Everyday useReports#
WhereCRM›Reports
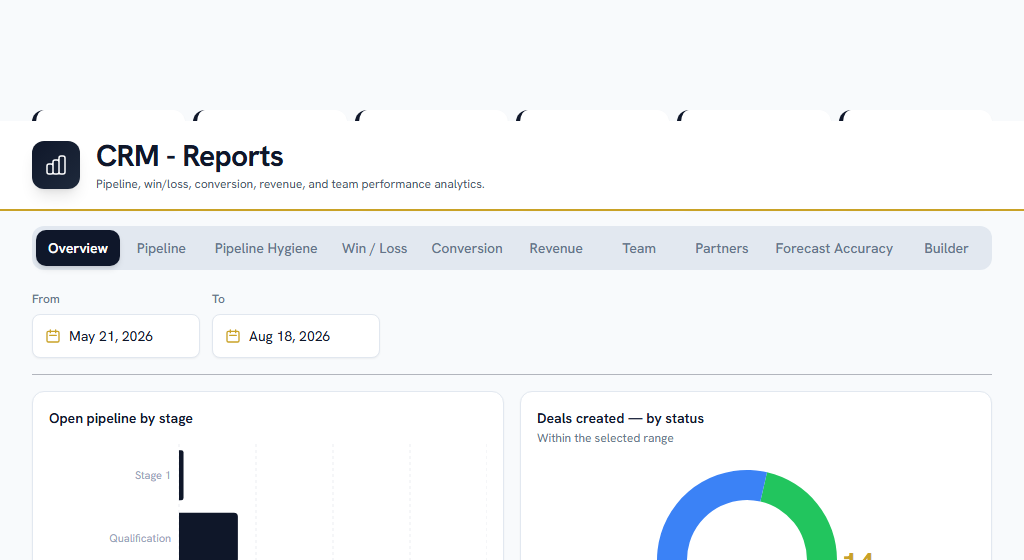
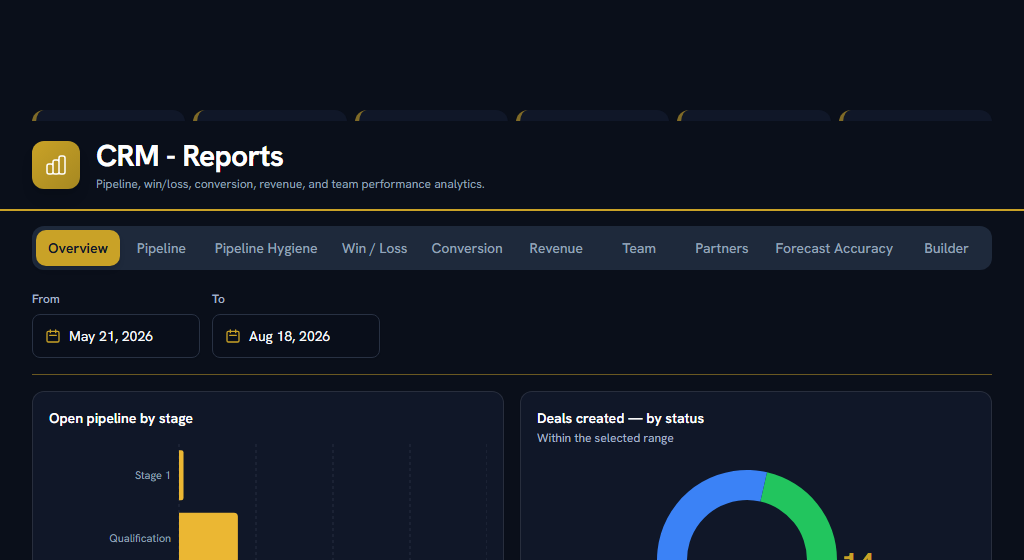
OpenReports
Ten tabs. The date range at the top applies across them and lives in the URL, so a link to a report lands somebody on the same range you were looking at.
| Tab | What it answers |
|---|---|
| Overview | The headline numbers for the range |
| Pipeline | What is open, by stage and by owner |
| Pipeline Hygiene | How long records have been quiet, where they are stuck, and why they were flagged |
| Win / Loss | What you won, what you lost, and to whom |
| Conversion | How leads become deals, and at what rate |
| Revenue | Closed revenue over time |
| Team | Per-person scorecard: win rate, deals created, deals lost, top performers |
| Partners | Sourced versus influenced revenue, approval rate, time-to-first-deal by tier |
| Forecast Accuracy | Past forecasts against what actually closed |
| Builder | The question none of the above asks |
Reports are company-wide, not scoped to what you own — they are analytics, and an owner filter narrows them when you want that. Pipeline and Team export to CSV, and every export is written to the workspace audit log.
Pipeline Hygiene is the reporting half of the Needs Attention queue described in People & Activities. The queue is a to-do list; this is the pattern behind it — which stage swallows records, which owner's list is ageing, and which of the three signals is doing the flagging.
The Builder#
Build a query without writing anything: pick the record type, tick the columns you want, add filter rows, choose how to group, summarise and sort, and press Run preview to see the answer before you save it. Saved reports come back on this tab.
Ten record types, and the last four are the ones worth knowing about:
| Record type | The question it answers |
|---|---|
| Leads, Contacts, Accounts, Deals | The pipeline, the people, and the companies |
| Products | The catalogue itself — what is in it, priced how |
| Follow-ups | Activity: what is due, what got done |
| Quotes, Sales Orders | The documents, by status, value, customer and date |
| Quote Lines, Order Lines | What you actually sold |
Reporting on what you sold
A quote or an order has a total; a line has a product on it. So "revenue by SKU by month", "units by brand", "which categories are we shipping" and "who bought this particular item" are all questions about lines, and until now none of them could be asked at all — the items were a number on a document and nothing more.
Pick Order Lines, group by SKU and Order month, summarise Line total with Sum, and that is the report. The line carries its own quantity, unit price, discount, tax and line total, and it reaches through to the product's SKU, name, brand, unit and category, to the document's number, status, date and month, and to the customer's name and type. Nothing has to be written and no data has to be re-entered.
**Group by month, not by date. Grouping by a date puts every line in a group of its own, which is a list, not a report. Order month and Quote month** are there for exactly this, and they read as 2026-09, so they sort correctly and a whole year's figures fit on one screen.
Three things about the numbers, so they are not a surprise:
- A line with no product shows a blank SKU. Freight, an installation visit, a one-off typed straight onto the quote — these are real lines with real money and no catalogue entry, so they group under a blank rather than disappearing. If that row is large, it is telling you what is missing from your catalogue.
- Category comes from the category list, not from the word on the product. Rename a category and last quarter's report follows it, which is the point of the link.
- A quote or an order in the recycle bin is not in the figures. Its lines stop counting the moment the document is binned, and come back if you restore it.
Quote Lines and Order Lines answer different questions, and it is worth being deliberate about which you pick: quote lines are what you asked for, including everything the customer never accepted; order lines are what they agreed to buy. Win rate lives in the gap between the two.
Section 07Everyday useForecasts#
WhereCRM›Forecasts
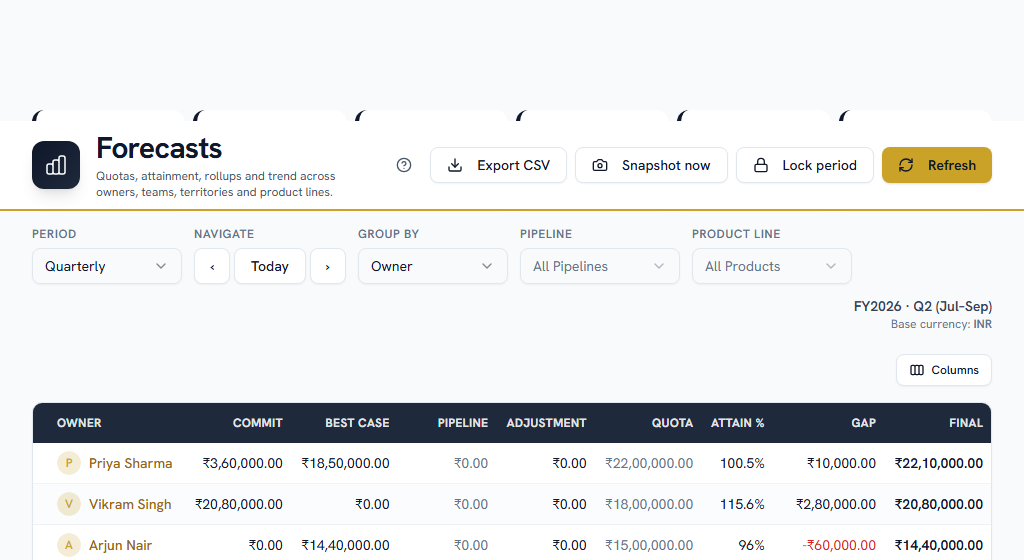
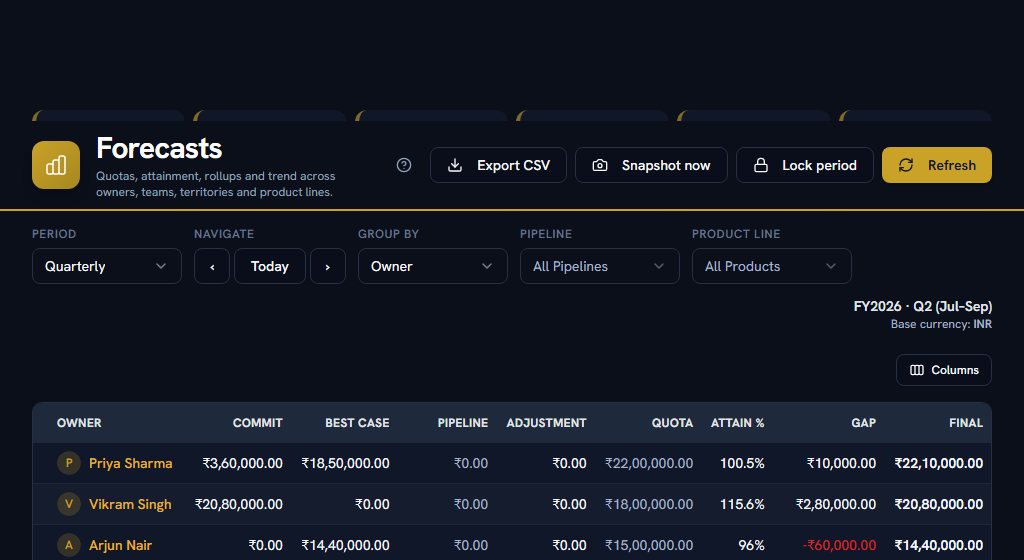
OpenForecasts
Every open deal whose expected close date falls in the period is placed in a bucket by the win probability of the stage it is sitting in:
| Bucket | Which deals | Read it as |
|---|---|---|
| Commit | Probability 75% or more, plus everything already Closed Won | Money you are standing behind |
| Best Case | 50% or more | Money you could get to |
| Pipeline | Under 50% | Everything else that is open |
Final is Commit plus Best Case plus any manual adjustments, and it is the number the rest of the page is about. All amounts are converted to your base currency.
There is nothing to switch on. A deal with a probability and a close date appears by itself.
"FY2026 · Q1" may not be January to March. Forecast quarters follow the fiscal year set on your company settings, so an April-to-March company sees Q1 as Apr–Jun. This is the commonest cause of "the forecast is empty" — the deals are real, the period is not the one you assumed. Use the ‹ › arrows or Today to move, and check the date range the header prints under the period name.
Targets#
The Quota Targets panel is the only place quotas exist in CRM; there is no separate screen. Choose a scope — Rep, Team or Territory — pick who it applies to, optionally narrow it to a product line, and enter the target in base currency. Click an existing target to edit it in place.
Quotas are what fill in the Quota, Attainment % and Gap columns. Attainment is Final ÷ Quota; Gap is Final − Quota, so a negative Gap means behind target.
Setting a quota also makes a row appear before any deals land, which is a useful way to see a rep with a target and nothing in the pipeline.
Grouping and drilling in#
The Group by switch changes what a row means:
- Owner — per sales rep
- Team — per manager, covering their whole reporting subtree
- Territory — by the deal's territory
- Product line — revenue split across product categories using each deal's quote lines; deals with no quote fall under "Unspecified"
Reps see themselves, managers see their team, admins see everyone.
Click any amount in the table — Commit, Best Case, Pipeline or Final — and a dialog lists the individual deals behind that cell, with owner, probability and value. That is the answer to "where is this number coming from", and it is one click away rather than an export.
Snapshots, adjustments and locking#
- A snapshot is a saved copy of the forecast at a moment. One is captured automatically every week, and Snapshot now takes one on demand. The in-period trend chart plots Commit, Best Case and Final across them, so you can see whether the month is improving or slipping.
- An adjustment is a manual plus-or-minus on an owner's forecast for a period, for the judgement the raw arithmetic cannot make. It flows into Final and shows in its own column, so it is never mistaken for a deal.
- Lock period freezes it: quotas and adjustments for that period can no longer be created, edited or deleted. Use it once the numbers are final; unlock from the same button to reopen.
- Probability Buckets raises or lowers the 75 and 50 thresholds, either for the whole company or per pipeline. Commit must stay above Best Case.
Was the forecast any good?#
Reports → Forecast Accuracy compares your snapshots for a closed period against what actually closed in it — the sales orders — and shows the variance and an accuracy percentage. It is backward-looking by nature, so pick a period that has already ended.
This is the loop that makes forecasting worth doing. A forecast nobody scores afterwards is a number somebody made up.
Accuracy is measured against orders, not against won deals. An order exists only because a deal was won on an accepted quote — so a company that wins deals without quoting has no orders, and this tab has nothing to compare against. See Pipeline.
Section 08Everyday useIf you get stuck#
In this order — most questions are answered before you reach the bottom.
- Look for help on the page itself. A ? in the page header opens the FAQs for that screen, and every settings screen carries a "How this works" panel with a worked example.
- Search the FAQs — the menu under your name, top right → FAQs. Search the words you can see on screen, rather than what you think the feature is called.
- Take a tour — the same menu → Help & Tours.
- Read the message. When Facto refuses something it says why, and usually what to do about it.
- Ask your own company — Support in the sidebar. A number that looks wrong here is nearly always a missing close date, a missing probability or an unenabled currency, and all three are your admin's to fix.
- Facto Support — the pinned block at the bottom of the sidebar. Admin-only: if your question needs Facto, raise it at step 5 and your admin will escalate it.